Power BI has become one of the most widely used business intelligence tools in modern organizations. Companies across industries rely on Power BI to transform data into dashboards and reports that support decision-making.
Because of this growing demand, many professionals are now exploring Power BI as a skill to transition into data analytics and business intelligence roles.
However, beginners often ask the same question:
What is the best way to learn Power BI from scratch?
This guide provides a complete Power BI learning roadmap, covering the essential skills, tools, and projects required to progress from beginner to advanced level.
What Is Power BI?
Power BI is a business intelligence platform developed by Microsoft that enables organizations to analyze data and create interactive dashboards.
Using Power BI, analysts can:
• connect to multiple data sources • clean and transform datasets • build data models • create interactive reports • share insights across teams
Because Power BI integrates easily with tools like Excel, SQL Server, Azure, and SharePoint, it has become a preferred analytics platform for many organizations.
Learning Power BI Through Structured Programs
Some learners explore Power BI through online tutorials and self-study. Others prefer structured learning paths that include guided exercises and real-world reporting scenarios.
Instructor-led programs—such as those offered by Excelgoodies—often combine Power Query, DAX calculations, data modeling, and dashboard design with hands-on reporting projects that simulate business analytics environments.
Step-by-Step Power BI Learning Roadmap
Learning Power BI is easier when approached step-by-step.
Below is a structured roadmap many analysts follow.
Step 1: Understand Data Fundamentals
Before learning Power BI, it is important to understand basic data concepts.
These include:
• datasets and tables • data types • business metrics • data cleaning principles
Understanding how data is structured helps you build more effective reports.
Step 2: Strengthen Excel Skills
Many Power BI professionals start their analytics journey with Excel.
Important Excel skills include:
• formulas and functions • pivot tables • data analysis tools • data cleaning techniques
Excel knowledge helps build a strong foundation before moving into Power BI.
Step 3: Learn Power BI Basics
The next step is learning how to use Power BI Desktop.
Key areas include:
• importing data • basic charts and visualizations • building simple dashboards • publishing reports
At this stage, the focus is on understanding how Power BI works.
Step 4: Learn Power Query for Data Transformation
Power Query is used to prepare data for analysis.
Analysts commonly use Power Query to:
• clean messy datasets • combine multiple data sources • reshape tables • automate data preparation
Data transformation is one of the most important skills for analytics professionals.
Step 5: Understand Data Modeling
Data modeling organizes datasets in a structure that supports efficient analysis.
Key concepts include:
• table relationships • star schema • fact and dimension tables
Understanding data modeling significantly improves report performance.
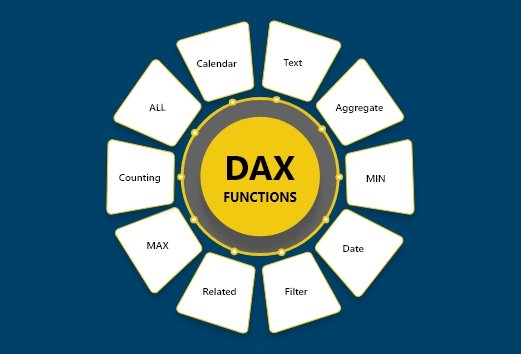
Step 6: Learn DAX (Data Analysis Expressions)
DAX is the formula language used in Power BI.
With DAX, analysts can create calculations such as:
Projects help demonstrate your ability to transform data into actionable insights.
How Long Does It Take to Learn Power BI?
The time required to learn Power BI depends on your starting point and learning approach.
Typical learning timelines include:
Beginner Level 1–2 months
Intermediate Level 3–4 months
Advanced Level 6 months or more
Consistent practice and hands-on projects accelerate the learning process.
Power BI Career Opportunities
After developing Power BI skills, professionals often transition into roles such as:
• Data Analyst • Business Intelligence Analyst • Power BI Developer • Reporting Analyst
Many organizations across Canada are actively hiring professionals with Power BI expertise.
If you are exploring the broader career path—including job roles, salary expectations, and opportunities across Canadian cities—you may also find our guide on How to Become a Power BI Data Analyst in Canada helpful.
Power BI Salary in Canada
Power BI professionals can earn competitive salaries across Canada.
Typical ranges include:
Entry-Level Analyst CAD 55,000 – CAD 70,000
Mid-Level Analyst CAD 70,000 – CAD 90,000
Senior BI Developer CAD 90,000 – CAD 120,000+
For readers interested in a more detailed breakdown of compensation trends across different cities and experience levels, you may refer to our guide on Power BI Salary in Canada (2026 Job Market Report).
Best Way to Practice Power BI
The most effective way to master Power BI is through hands-on practice.
Ways to practice include:
• working with real datasets • building dashboards regularly • participating in analytics challenges • developing portfolio projects
Some learners prefer structured programs that combine projects with guided instruction.
Training programs such as the Power BI courses offered by Excelgoodies focus on practical reporting scenarios and dashboard development used in business environments.
Final Thoughts
Power BI has become one of the most valuable skills in modern data analytics. As organizations continue to adopt data-driven decision-making, professionals who understand data transformation, modeling, and visualization are increasingly in demand.
By following a structured roadmap that includes data fundamentals, Power Query, data modeling, DAX, and dashboard projects, learners can gradually develop the expertise required for analytics roles.
Whether you choose self-learning, certification programs, or instructor-led training, consistent practice and real-world projects are essential for mastering Power BI.
Editor’s Note
This article is intended as an educational overview of the Power BI learning journey from beginner to advanced level.
For readers interested in guided learning programs, some training providers offer instructor-led Power BI courses that combine data transformation, modeling, DAX calculations, and dashboard design through real reporting projects.
Programs such as the Power BI training offered by Excelgoodies focus on practical analytics scenarios commonly used in organizations.
Readers may explore different learning approaches—including self-study, certifications, and structured training—to determine what best supports their learning goals.


 Power BI
 SQL
SQL Power Apps
 Power Automate
 Microsoft Fabrics
 Azure Data Engineering