Power BI Projects for Data Analyst Portfolio (Complete Guide)
Introduction
Power BI has become one of the most widely used tools for data analytics and business intelligence. Organizations rely on Power BI dashboards to analyze performance, track key metrics, and support strategic decision-making.
For individuals learning Power BI, building practical projects is one of the most effective ways to develop real skills and demonstrate expertise.
Many hiring managers evaluating candidates for analytics roles often ask one question:
Can the candidate demonstrate real Power BI projects?
This is why building a strong Power BI project portfolio is an important step toward becoming a data analyst.
This guide explains the best Power BI projects you can build, how to structure your portfolio, and how projects can help you transition into analytics roles.
Why Power BI Projects Are Important
Learning Power BI concepts is useful, but projects help translate knowledge into practical experience.
Power BI projects demonstrate that you can:
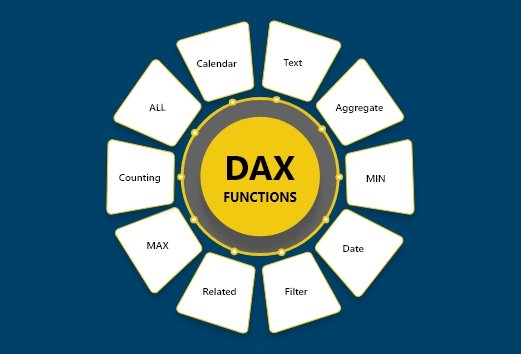
• clean and transform data • build data models • create DAX calculations • design interactive dashboards • communicate insights visually
Employers often value real project experience because it reflects how Power BI is used in actual business environments.
Learning Power BI Through Hands-On Projects
Many learners practice Power BI by downloading datasets and building dashboards independently. Others prefer guided learning environments where projects are integrated into the curriculum.
Instructor-led programs—such as the Power BI Course offered by Excelgoodies—often combine Power Query transformations, DAX calculations, and dashboard design with structured reporting projects that simulate real business analytics scenarios.
For many learners, working on practical projects significantly accelerates the learning process.
Best Power BI Projects for Beginners
If you are starting your Power BI journey, begin with simple datasets and gradually build more complex dashboards.
Below are some popular beginner-friendly projects.
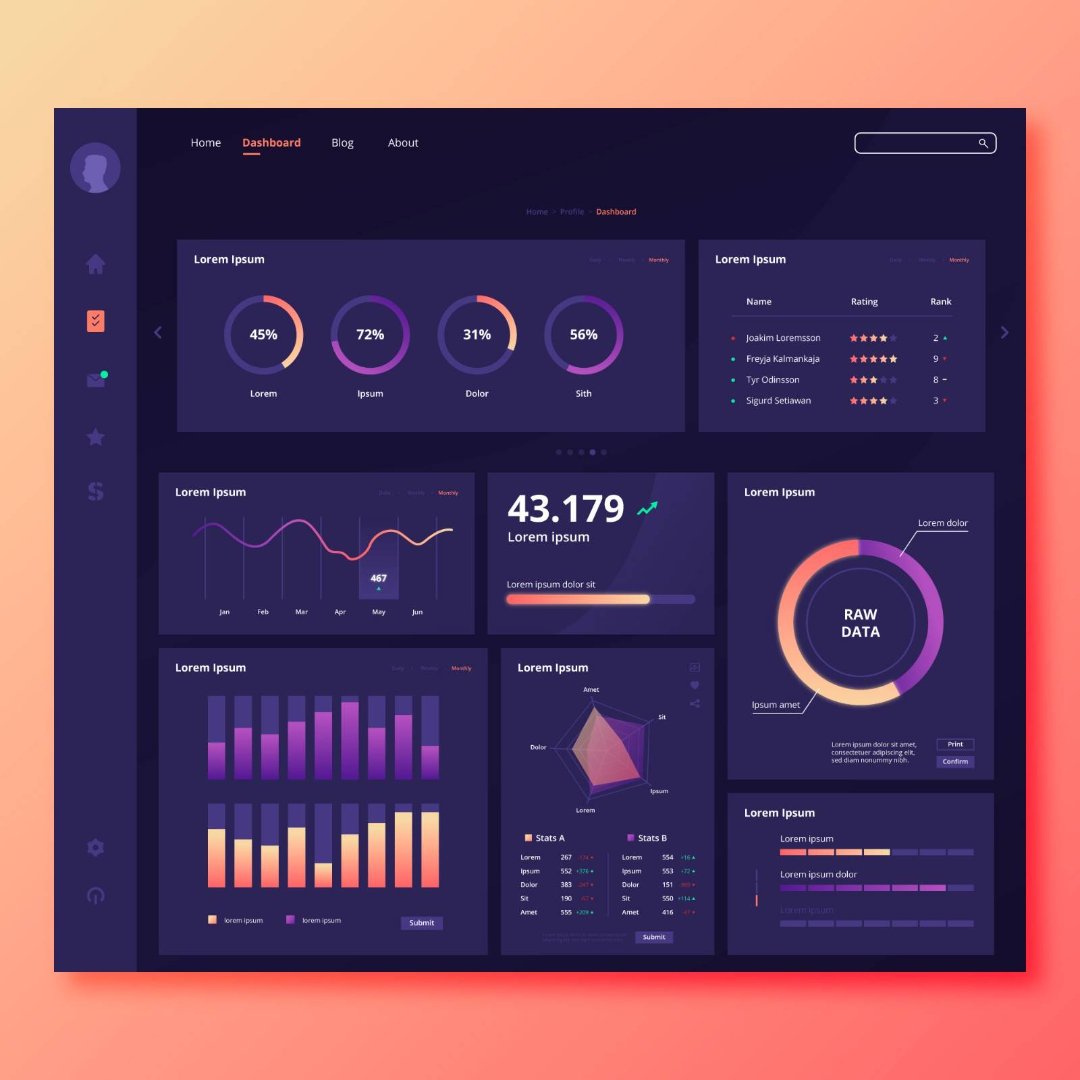
Sales Performance Dashboard
A sales analytics dashboard is one of the most common Power BI projects.
Typical metrics include:
• revenue by region • product performance • monthly sales trends • top-performing sales representatives
This project helps you practice data modeling and KPI visualization.
Advanced projects demonstrate deeper analytical and modeling skills.
Where to Find Power BI Datasets
To build projects, you will need datasets.
Common sources include:
• government open data portals • Kaggle datasets • financial datasets • retail analytics datasets • publicly available business datasets
Working with realistic datasets helps simulate real-world analytics scenarios.
How to Build a Strong Power BI Portfolio
A strong Power BI portfolio typically includes three to five well-designed dashboards.
Your portfolio should demonstrate:
• different business scenarios • clear dashboard design • meaningful insights • well-structured data models
Many data analysts publish their projects on platforms such as GitHub or share screenshots on LinkedIn to showcase their work.
How Projects Help You Become a Data Analyst
Power BI projects are often the bridge between learning and employment.
They help demonstrate that you can:
• work with real data • solve business problems • communicate insights effectively
For readers exploring the broader analytics career path—including required skills, certifications, and job opportunities—you may find our guide on How to Become a Power BI Data Analyst in Canada helpful.
Power BI Salary in Canada
Professionals with strong Power BI skills can earn competitive salaries in Canada.
The most effective way to learn Power BI is through consistent practice.
Helpful approaches include:
• building dashboards regularly • analyzing real datasets • recreating dashboards used by companies • documenting insights and explanations
Some learners also choose structured programs that include guided project development.
Programs such as the Power BI courses offered by Excelgoodies often combine project-based learning with instructor guidance and reporting scenarios commonly used in business environments.
Final Thoughts
Power BI projects play an essential role in developing analytics skills. By building dashboards that analyze real-world data, learners gain practical experience that helps them transition into professional analytics roles.
A well-designed portfolio showcasing different business scenarios can significantly improve job prospects in the data analytics field.
Whether you choose self-learning or structured training, consistent practice and real projects remain the most effective way to master Power BI.
Editor’s Note
This article provides an overview of Power BI portfolio projects that help learners build practical analytics skills.
Many learners practice independently by working with open datasets. Others choose structured learning environments where projects are integrated into the curriculum.
Instructor-led programs such as the Power BI Training offered by Excelgoodies combine Power Query, DAX, data modeling, and dashboard design with hands-on reporting projects used in real business analytics scenarios.
Readers may explore different learning paths and select the approach that best supports their career goals.


 Power BI
 SQL
SQL Power Apps
 Power Automate
 Microsoft Fabrics
 Azure Data Engineering