Power BI Salary in Canada (2026 Job Market Report)
Introduction
Data analytics has become one of the most in-demand skill sets in Canada. Organizations across industries increasingly rely on data to guide strategic decisions, improve operations, and identify growth opportunities.
As a result, professionals with expertise in analytics tools such as Power BI are seeing growing career opportunities.
Many professionals exploring analytics careers often ask:
How much do Power BI professionals earn in Canada?
This report provides an overview of salary ranges, hiring trends, and factors that influence compensation for Power BI professionals across Canada.
What Is Power BI?
Power BI is a business intelligence platform developed by Microsoft that enables organizations to transform raw data into dashboards and analytical reports.
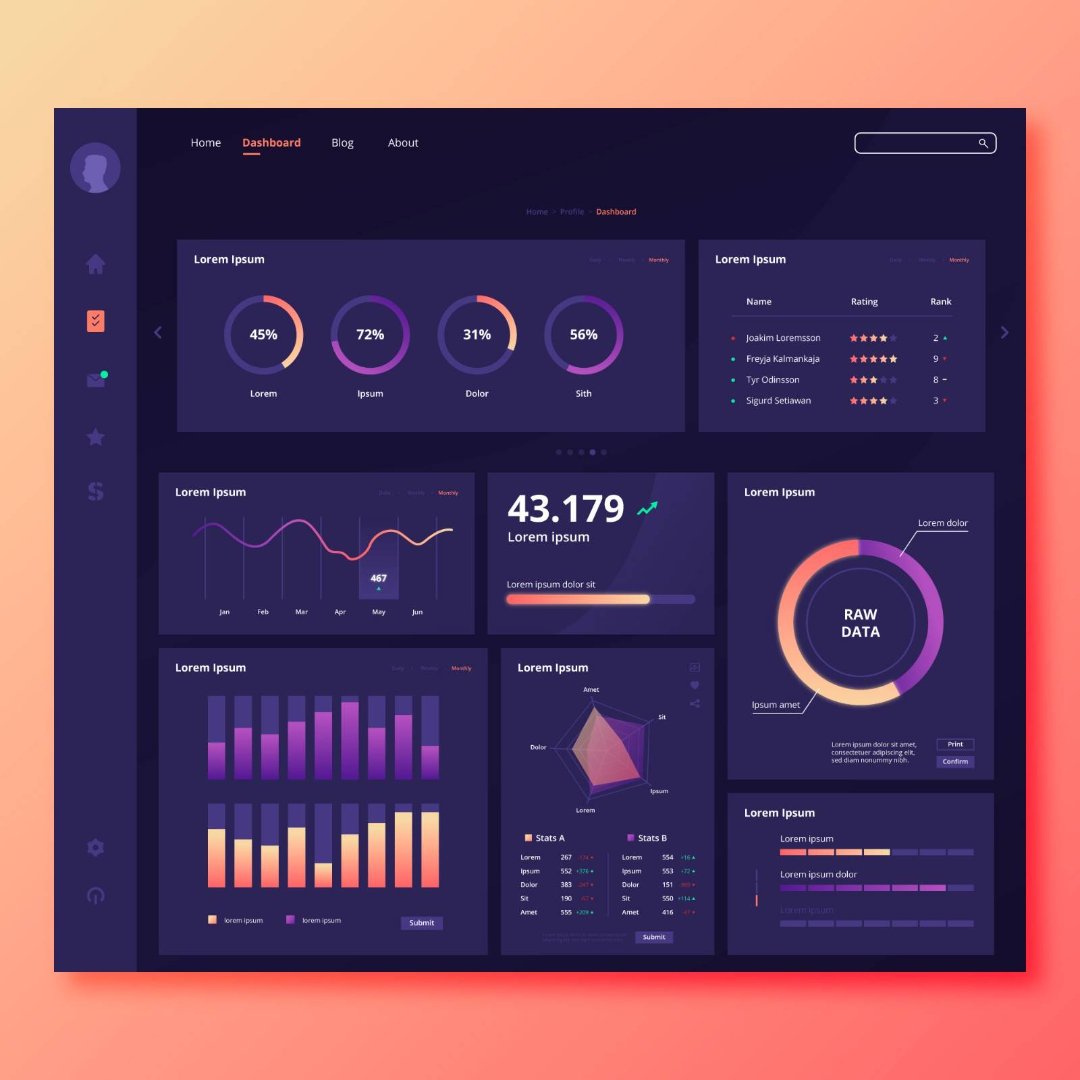
With Power BI, analysts can:
• connect to multiple data sources • clean and transform data • build data models • create interactive dashboards • share insights across organizations
Because of its integration with Excel, SQL Server, and Azure, Power BI has become one of the most widely used BI tools in Canada.
Learning Power BI for Analytics Careers
Professionals entering analytics often build Power BI skills through self-learning, certifications, and hands-on projects.
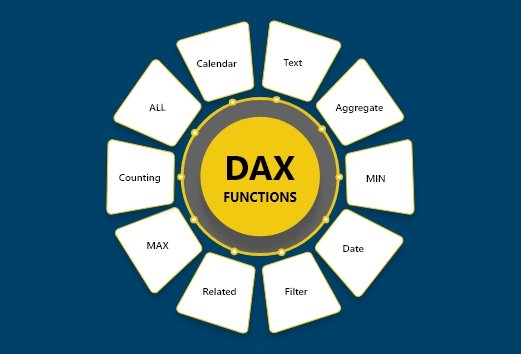
Some learners prefer instructor-led programs that combine Power Query, DAX, data modeling, and dashboard development with practical reporting scenarios.
Programs such as the Power BI Course offered by Excelgoodies focus on real business analytics workflows and dashboard projects that reflect how Power BI is used in organizations.
Average Power BI Salary in Canada
Power BI salaries vary depending on experience level.
Entry-Level Data Analyst
Experience: 0–2 years
Salary range: CAD 55,000 – CAD 70,000
Entry-level roles often focus on building reports and supporting analytics teams.
Mid-Level Power BI Analyst
Experience: 3–5 years
Salary range: CAD 70,000 – CAD 90,000
Professionals at this level typically handle complex dashboards and analytics projects.
Senior Power BI Developer
Experience: 5+ years
Salary range: CAD 90,000 – CAD 120,000+
Senior professionals may lead BI initiatives and design enterprise analytics solutions.
Power BI Salaries by Canadian City
Toronto
Salary range: CAD 70,000 – CAD 110,000
Toronto has one of the largest analytics job markets in Canada.
Vancouver
Salary range: CAD 65,000 – CAD 105,000
Technology companies and startups drive analytics hiring.
Calgary
Salary range: CAD 65,000 – CAD 95,000
Energy and logistics companies employ many analysts.
Montreal
Salary range: CAD 60,000 – CAD 95,000
Montreal has a growing analytics ecosystem.
Skills That Increase Power BI Salary
Professionals who combine Power BI with additional technical skills often command higher salaries.
Important complementary skills include:
• SQL • data modeling • DAX calculations • dashboard design • business analytics knowledge
While salary expectations are an important factor when considering an analytics career, many professionals also want to understand the steps required to enter the field.
If you are exploring this path, our guide on How to Become a Power BI Data Analyst in Canada explains the learning roadmap, skills, certifications, and project experience needed to transition into analytics roles.
Editor’s Note
This article is intended to provide an overview of Power BI salary trends and analytics job opportunities in Canada.
For professionals looking to develop Power BI skills, there are several learning approaches including self-study, certification programs, and instructor-led training.
Some training providers—such as Excelgoodies—offer structured Power BI Training programs that focus on practical reporting projects, Power Query transformations, DAX calculations, and dashboard design used in real business environments.
Readers may explore different learning options and select the approach that best fits their career goals.


 Power BI
 SQL
SQL Power Apps
 Power Automate
 Microsoft Fabrics
 Azure Data Engineering