How to Become a Power BI Data Analyst in Canada (Complete Career Guide)
Introduction
Data analytics has become one of the fastest-growing career paths in Canada. Organizations across industries—from finance and retail to healthcare and logistics—are increasingly relying on data to support decision-making and improve business performance.
Among the many analytics tools used today, Power BI has emerged as one of the most widely adopted business intelligence platforms. Companies use Power BI to transform large volumes of data into dashboards and reports that help leadership teams understand trends, track performance, and make strategic decisions.
Because of this growing demand for analytics, many professionals are asking an important question:
How can I become a Power BI Data Analyst in Canada?
This guide explains the complete career roadmap—from skills and learning steps to salary expectations and job opportunities across Canada.
What Is Power BI?
Power BI is a business intelligence and data visualization platform developed by Microsoft. It allows organizations to transform raw data into interactive dashboards and analytical reports.
With Power BI, analysts can:
• Connect to multiple data sources • Transform and clean datasets • Create data models • Build interactive dashboards • Share insights across teams
Because Power BI integrates seamlessly with tools such as Excel, SQL Server, Azure, and SharePoint, many organizations across Canada have adopted it as their primary reporting and analytics platform.
Learning Power BI with a Structured Approach
Many professionals begin learning Power BI through a mix of online resources, tutorials, and project practice. Others prefer structured programs that provide guided learning and hands-on reporting exercises.
Some instructor-led programs—such as those offered by Excelgoodies—focus on building real reporting dashboards using Power Query, DAX, and business analytics scenarios. For learners who prefer guided training, structured courses can help accelerate the learning process.
Why Power BI Is in Demand in Canada
The demand for Power BI professionals in Canada continues to grow as organizations adopt data-driven decision making.
Several factors contribute to this demand.
Strong Microsoft Ecosystem
Many companies in Canada already use Microsoft technologies such as Excel, Azure, and SQL Server. Power BI integrates easily with these tools.
Growing Data Culture
Organizations are increasingly relying on analytics to track performance, forecast trends, and identify growth opportunities.
Self-Service Reporting
Power BI allows business users to build reports without heavy reliance on IT departments.
Because of these factors, Power BI skills are frequently listed in data analyst job postings across Canada.
What Does a Power BI Data Analyst Do?
A Power BI Data Analyst helps organizations understand their data and generate insights that support decision-making.
Typical responsibilities include:
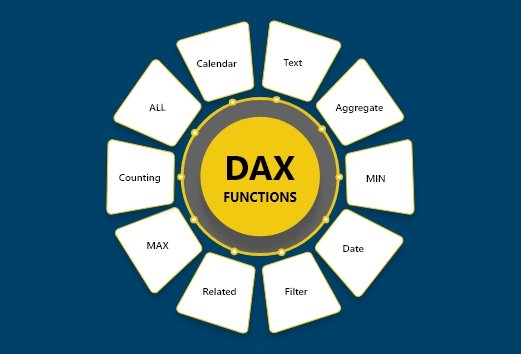
• collecting and preparing data from multiple sources • cleaning and transforming datasets using Power Query • designing data models • writing DAX calculations • building dashboards and reports • presenting insights to stakeholders
Power BI analysts often collaborate with teams such as finance, marketing, operations, and management.
Skills Required to Become a Power BI Data Analyst
Developing a strong Power BI career requires a combination of technical and analytical skills.
Excel Fundamentals
Many professionals begin their analytics journey with Excel. Understanding formulas, pivot tables, and data analysis concepts creates a strong foundation.
These projects demonstrate your ability to transform raw data into meaningful insights.
Power BI Salary in Canada
Power BI professionals earn competitive salaries across Canada.
Typical ranges include:
Entry-Level Analyst CAD 55,000 – CAD 70,000
Mid-Level Analyst CAD 70,000 – CAD 90,000
Senior Power BI Developer CAD 90,000 – CAD 120,000+
Salary expectations for Power BI professionals can vary based on experience, technical expertise, and the city in which you work. Professionals working in major Canadian technology hubs such as Toronto, Vancouver, or Calgary often earn higher salaries due to strong demand for analytics skills.
For readers interested in a more detailed breakdown of compensation trends across different cities and experience levels, you may refer to our guide on Power BI Salary in Canada (2026 Job Market Report).
Industries Hiring Power BI Professionals
Power BI is used across many sectors including:
• finance and banking • retail and e-commerce • healthcare • supply chain and logistics • technology companies • government agencies
As analytics adoption increases, the demand for Power BI professionals is expected to continue growing.
Tips to Get Your First Power BI Job
Build a Portfolio
Create multiple dashboards showcasing different analytics scenarios.
Learn SQL
SQL helps analysts access and work with databases.
Share Projects Online
Publishing dashboards on GitHub or LinkedIn helps demonstrate your skills.
Practice Interview Questions
Prepare for topics such as data modeling, DAX, and dashboard design.
Editor’s Note
This article is intended as an educational overview of the Power BI data analyst career path in Canada. For learners who prefer guided training rather than self-learning, some training providers offer instructor-led Power BI programs that combine Power Query, DAX, and dashboard design with practical reporting projects.
For example, the Power BI Training programs offered by Excelgoodies focus on building real business dashboards and analytics workflows that are commonly used in organizations. Readers may explore different learning paths—including self-study, certification programs, and structured training—to determine the approach that best supports their career goals.


 Power BI
 SQL
SQL Power Apps
 Power Automate
 Microsoft Fabrics
 Azure Data Engineering